Very nice video
Wednesday, November 23, 2016
Thursday, November 17, 2016
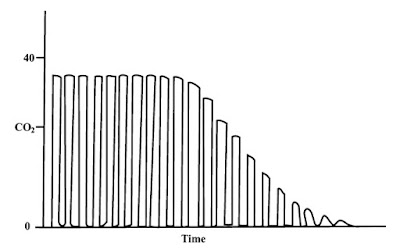
Capnograph Interpretation
Phase I: At the start of exhalation, anatomical and physiological dead space is
expired, so no CO2Phase II: Exhalation continues, so CO2 rises
Phase III: CO2 plateau
Phase IV: Inspiration
Capnograph in obstructive airway

Rebreathing
expired, so no CO2Phase II: Exhalation continues, so CO2 rises
Phase III: CO2 plateau
Phase IV: Inspiration
Capnograph in obstructive airway

- Fin-shaped appearance
- Slanting and prolongation of expiratory phase
- eg. COLD, kinked ETT
Rebreathing
- Elevated baseline from Zero
- eg. low gas flow
Hyperventilation
- High Resp Rate
- Low EtCO2
Hypoventilation
- Low Resp Rate
- High EtCO2
Sudden Fall EtCO2
- Asystole,
- Hypotension
- Massive Pulmonary Embolism
Small Air Emboli
Friday, November 11, 2016
critical care guidelines
Infection:
Surviving Sepsis Guidelines
IDSA HAP Guidelines 2016
IDSA CAP Guidelines 2007
IDSA Guidelines for intra abdominal infection 2010
IDSA Guidlines for CAUTI 2010
IDSA Guidelines for management of Clostridium difficile Infection 2010
IDSA Guidelines for the Management of Bacterial Meningitis 2004
IDSA Guidelines for Management of Encephalitis 2008
IDSA Guidelines for Endocarditis Management 2015
Nurvous System:
Guidelines for the management of Acute stroke
Guidelines for the management of hemorrhagic stroke 2015
Guidelines for the Management of Aneurysmal Subarachnoid Hemorrhage 2012
Guidelines for the Management of Severe Traumatic Brain Injury
Guideline: for Treatment of Convulsive Status Epilepticus 2016
Respiratory System:
IABP Graph Analysis
For analysis of graph first put patienton 2:1 Augmentaion
Normal Graph
DIA: Unassisted End Diastolic Pressure
SYS: Unassisted Peak Systolic Pressure
AUG: Diastolic Augmentation/Peak Diastolic Pressure
ADIA: Assisted End Diastolic Pressure
ASYS: Assisted Peak Systolic Pressure (Systole after IAB deflation)
DN: Dicrotic Notch
Early Inflation
Inflation of Valve before dicrotic notch
Can be identified by drawing a line from dicrotic notch of unassisted pulse
Forced closure of Aortic valve
Reduces Stroke volume
Increased LV End diastolic volume(LVED)
Increased work load
Late Inflation
Dicrotic notch is visible brfore augmented diastolic graph
AUG less than optimum
Decreased perfusion pressure and volume to coronary arteries
Early Deflation
Augmented Systolic =Non augmented systolic pressure
U shape at Augmented end diastolic pressures
No afterload reduction
Late Deflation
Augmented end diastolic pressure > Non Augmented end Diastolic pressure
Violates rule 2for deflation
Subscribe to:
Comments (Atom)


